We all remember how lousy the 2012 and 2016 presidential polls were. However, the political polls for the 2018 midterms were worse.
For the mid-terms the polls were correct when they said the Democrats would take control of the House of Representatives — an easy guess, really — but what most got wrong was by how many that new majority would grow. For months we were told that there was going to be a massive “blue wave” of new Democrats winning election and streaming into Washington.
In reality? Not so much.
Rowan Scarborough noted all the significant misses by pollsters:
Florida governor: The last 10 polls had pegged Democratic Tallahassee Mayor Andrew Gillum the winner. But former Rep. Ron DeSantis won by 0.7 percentage points [not counting the mysterious “found votes” in Broward County]. While some wrong polls lay within the margin of error, Quinnipiac College in New York picked Mr. Gillum to win by 7 points. The St. Petersburg poll, NBC/Marist, Emerson College and the University of Florida had Mr. Gillum winning by 4 to 6 points.
Florida Senate: Nearly every late survey picked Democratic Sen. Bill Nelson to retain his seat. He lost to GOP Gov. Rick Scott by 0.4 percentage points[not counting the mysterious “found votes” in Broward County]. Again, Quinnipiac was way off, predicting a 7-point Nelson win. Emerson College also botched it, saying Mr. Nelson would win by 5 points. The St. Petersburg poll nailed the race at a 1 percentage-point Scott victory.
Missouri Senate: Several polls missed Republican Josh Hawley’s 6 percentage-point win against Democratic Sen. Claire McCaskill. NBC/Marist had her up by 3 points. Emerson and the Republican firm Trafalgar correctly saw the Hawley win, at 3 and 4 percentage points, respectively.
Georgia governor: Trafalgar badly overestimated Republican Brian Kemp’s final tally. An outlier in this race, the company said Mr. Kemp would defeat Democrat Stacey Abrams by 12 points. Kemp won by 1.6 percent. Emerson and the Atlanta Constitution were spot on.
Nevada Senate: Trafalgar missed this race, forecasting a 3 percentage-point win for GOP Sen. Dean Heller. Democrat Jacky Rosen won by 5 point
Indiana Senate: Fox News badly missed here, predicting an easy win for Democratic Sen. Joe Donnelly against Republican Mike Braun. Fox said Mr. Donnelly would win by 7 percentage points. He lost by 7.8 points, meaning Fox was off by 14 points. NBC/Marist also saw a Donnelly win, by 3 points.
Arizona Senate: Again NBC/Marist was off, saying Democrat Kirsten Sinema would win by 6 percentage points; CNN said by 4 points. Republican Rep. Martha McSally is leading by 2.2 percentage points, but a large number of mail-in ballots are still to be counted.
Ohio governor: A number of forecasters botched this race. Former Sen. Mike DeWine beat Democrat Richard Cordray by 4.3 percentage points. NBC/Marist’s last poll had it a tie. Quinnipiac had Mr. Cordray up by 2 points, Emerson by 3 and Gravis by 5 in their final polls.
Scarborough has much more at his article. Go take a look.
Texas Senate: The Texas polls were off the other way. Trafalgar had Cruz ahead by 9, the local CBS 11/Dixie Strategies poll had Cruz +10, Quinnipiac had Ted Cruz up by 5 when in reality he won by 2.6%. In this case, the pollsters may have an excuse. With the GOP governor Abbot way ahead, and Cruz with a healthy lead many Republicans may have stayed home because the need to vote wasn’t as urgent.
The lesson of the 2018 polls, indeed all election polls is they are interesting and fun to follow especially for political geeks like yours truly, but one shouldn’t get too excited about them one way or the other. As long as the questions aren’t phrased in a biased manner, it’s not that difficult to ask a few hundred people who will get their vote. And the vast majority of the major polls do not bias their questions.
The tricky part is figuring who is going to vote. Each pollster has their own proprietary model for election turnout. However, voter turnout is not an exact model, it’s nothing more than an educated guess based on historical trends and asking people how sure they are that they will vote. But there are many other factors.
A great example is the 2008 election. California’s referendum 8, was an amendment to its state constitution banning same-sex marriage and polls showed it would fail by a small margin. What wasn’t figured into the turnout model was that presidential candidate Barack Obama would motivate more African-American’s to come out and vote. Many of those African-Americans were devout Christians who did not approve of same-sex marriage. Therefore thanks to the Barack Obama turnout, the amendment passed.
In 2012, many polls got the turnout entirely wrong based on each party’s excitement about voting. They believed the demographic composition of voters would be different than 2008. Some even said Romney would win or that the race was too close to call. When it came time to vote the demographic composition of voters was similar to 2008, this Obama was reelected by a wide margin.
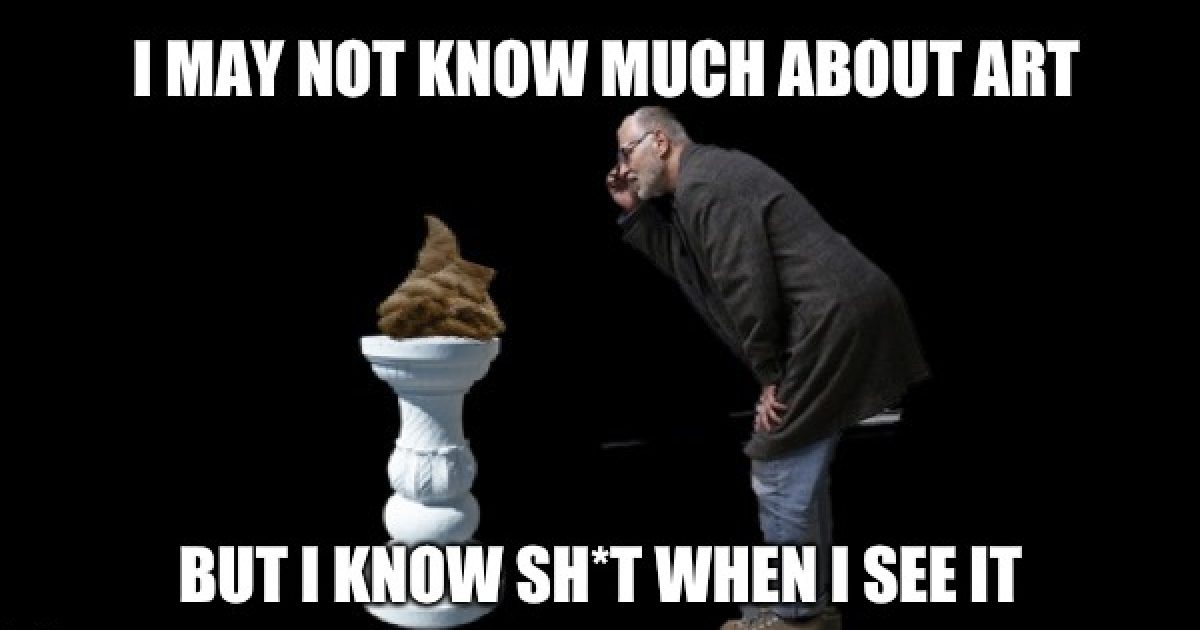
Any day now the 2020 election season will begin (the Iowa caucuses are only 86 days away from Nov. 9th, 2018) and so will the polls. When the polls begin, remember the trends are more worthwhile than any one poll to determine how your favorite may be doing. But most important do not take them take them too seriously, polling is as much of an art as it is a science. And the past few elections have proven that not all art is beautiful.